Data on Environmental Impacts of Business Activities
CY2024 Key Performance


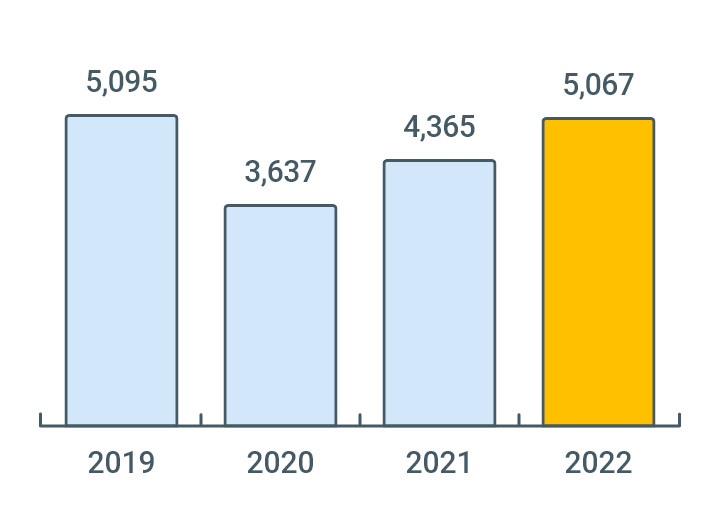
Changes in Environmental Impact Data Over Time
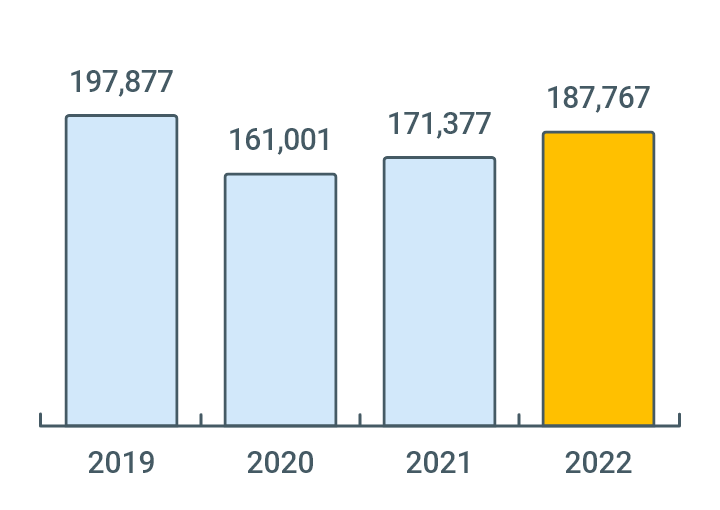
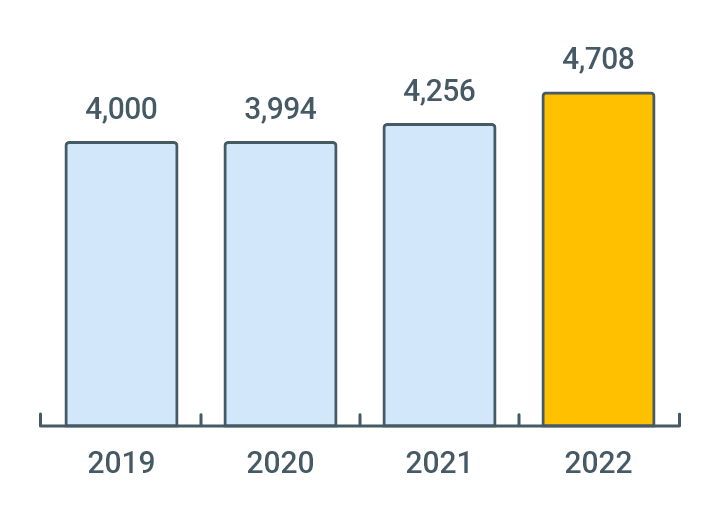
Until 2022, the environmental impact had been increasing due to plant expansion. Since 2023, GHG emissions and water consumption have decreased due to a decrease in production volume caused by supply-demand easing and improvements in production efficiency.
-
GHG Emissions (Scopel,Scope2)
Unit:Tons-co2
-
Water Usage (Purchased volume)
Unit:TCM
-
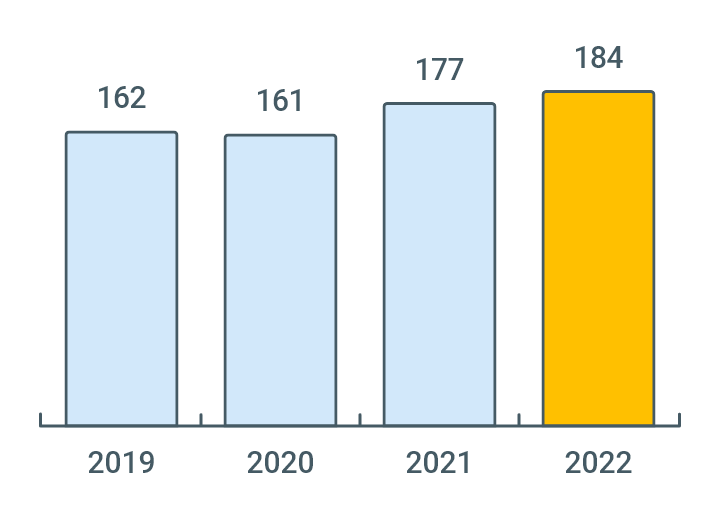
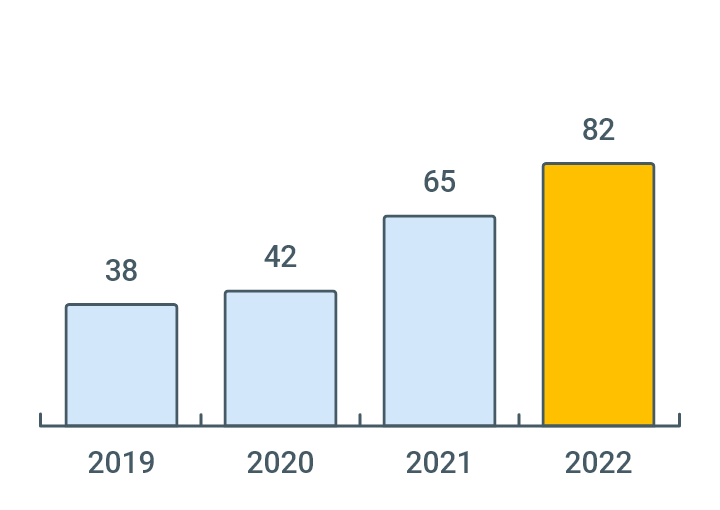
PRTR Chemical Substances Usage
Unit:Tons
-
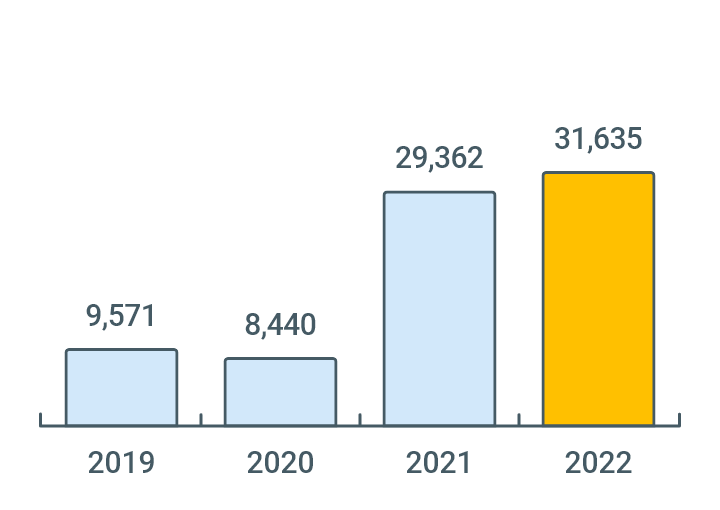
Industrial Waste
Unit:Tons
※The CO2 conversion coefficients for electricity consumption are calculated using emission factor provided by electric suppliers.
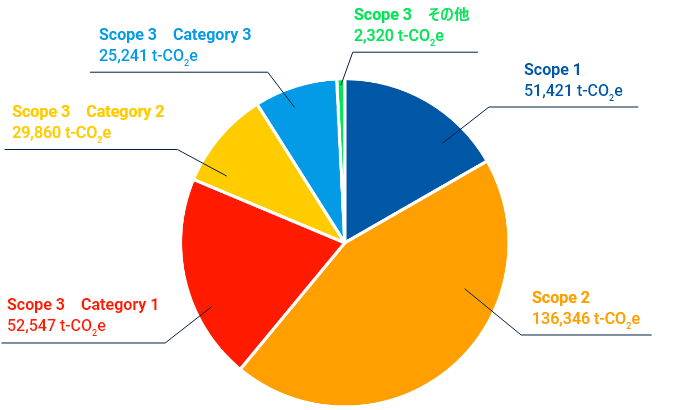
Greenhouse Gas (GHG) Emissions in 2024
USJC has calculated our GHG emissions in accordance with ISO14064-1:2018 and our carbon footprint (CFP) in accordance with ISO14067:2018. We will use this information to proactively engage in decarbonization with our customers.
-
- Calculation period
- January 1, 2024 -December 31, 2024
-
- Total GHG emissions
- 293,724 t-CO2e
-
- CFP※
- 1,029.3 ㎏-CO2e per sheet
※CFP:GHG Emissions per wafer USJC manufactured.
Breakdown
| Category of Emission | GHG Emissions (t-CO2e) | Percentage (%) | |
|---|---|---|---|
| Scope 1 | Direct GHG Emissions | 29,188 | 9.9 |
| Scope 2 | Indirect GHG Emissions from Supplied Energy | 153,686 | 52.3 |
| Scope 3 | Indirect GHG Emissions other than Scope1 or Scone2 | 110,850 | 37.7 |
| Total Amount of Emissions | 293,724 | 100 | |
| Breakdown of Scope3 | GHG Emissions (t-CO2e) | Percentage (%) | |
|---|---|---|---|
| Category 1 | Purchased Products and Services | 61,109 | 20.8 |
| Category 2 | Capital Goods | 21,507 | 7.3 |
| Category 3 | Fuel and Energy Activities not included in Scope1 or Scope2 | 26,080 | 8.9 |
| Category 4 | Transportation, Distribution ( Upstream) | 395 | 0.1 |
| Category 5 | Waste Generated in Operation | 371 | 0.1 |
| Category 6 | Business Travel | 130 | 0.1 |
| Category 7 | Employee Commuting | 1,140 | 0.4 |
| Category 8 | Transportation, Distribution (Downstream) | 119 | 0 |
Since 2022, the global warming potential (GWP) of the IPCC 6th Assessment Report has been applied.
In addition, a part of Scope 3 was calculated using "National Research and Development Agency, National Institute of Advanced Industrial Science and Technology, Safety Science Research Division IDEA Ver.3.2."
Water Footprint in 2024
USJC has calculated our water footprint (WFP
-
- Comprehensiveness
- Non-Comprehensive Water Footprint
-
- Calculation Period
- January 1, 2024 - December 31, 2024
※WFP:Water Usage per wafer USJC manufactured
Breakdown
| Usage Phase | Green Water (㎡/wafer) |
Blue Water (㎡/wafer) |
Gray Water (㎡/wafer) |
Total (㎡/wafer) |
|---|---|---|---|---|
| Supplier Phase | 0.0 | 9.3 | 14.6 | 24.0 |
| Manufacturing Phase | 0.0 | 14.4 | 12.8 | 27.3 |
| Total Volume Usage | 0.0 | 23.8 | 27.5 | 51.3 |
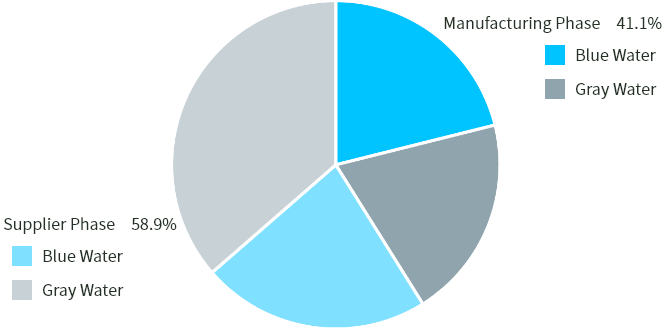
- Supplier Phase 58.9%
- Blue Water
- Gray Water
- Manufacturing Phase 41.1%
- Blue Water
- Gray Water
Citing the Calculation Methodology of The Water Footprint Assessment Manual (2011)
- Green Water
- Rainwater withdrawal
- Blue Water
- Water withdrawal other than rainwater
- Gray Water
- Amount of wastewater discharged when the pollution concentration of wastewater is diluted until it becomes equal to the environmental standard of the discharge water body(Indicators used: BOD, COD, total nitrogen, total phosphorus, SS)
In addition, part of the WFP at the raw material procurement stage was calculated using "National Research and Development Agency, National Institute of Advanced Industrial Science and Technology, Safety Science Research Division IDEA Ver.3.2."
Reduce Discharges of VOCs
USJC strives to reduce our environmental impact by preventing the release of harmful substances into the atmosphere as we properly remove organic exhaust-gases containing VOCs using activated carbon adsorption facilities.
The addition of an activated carbon adsorption facility for VOCs in March 2023 has improved VOC removal capacity, restoring and maintaining it at the level prior to 2021. In 2025, we will strengthen activated carbon management to further improve the removal capacity, and we will also evaluate the latest equipment to be introduced in 2026.
-
VOC emissions
Unit:Tons
-
Reduce PFCs Emissions
We have been making effort to reduce GHG emissions other than CO2 (PFC, HFC, NF3, SF6). On production lines, catalytic decomposition systems have been installed on all equipment producing GHG, and we aggressively promote GHG emission reduction.
We strive to improve the accuracy of calculations gradually in order to identify emissions more properly by changing the calculation method to the 2019 revision of the IPCC Guidelines since 2021.
-
PFCs Emissions
Unit:Tons-co2
-